March 24, 2012
The History of Lunar Cratering

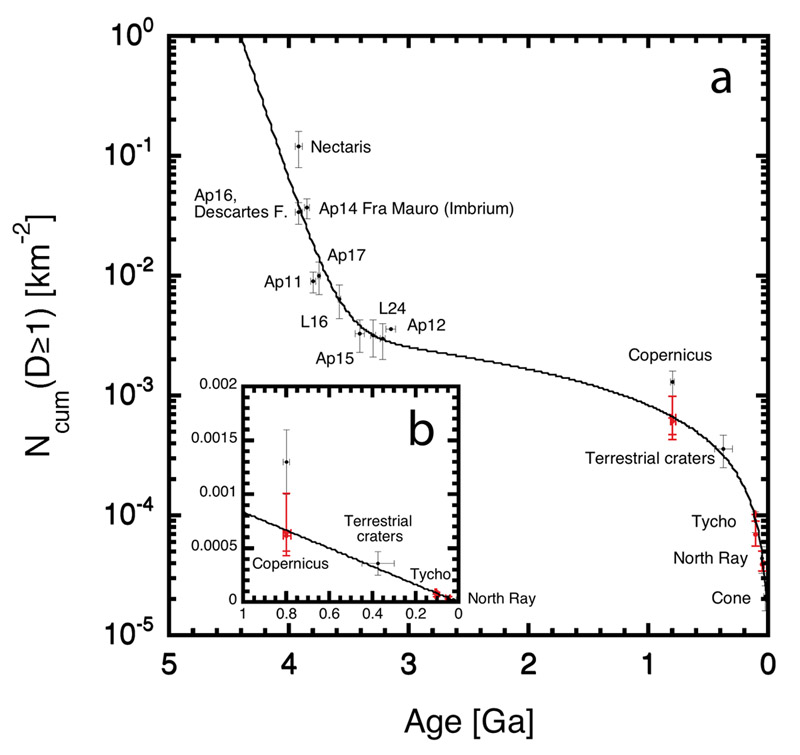
figure from Heisinger and colleagues (2012) as shown on LRO Featured Image website
This is one of the most important diagrams in lunar science. It is the basis for estimating ages of parts of the Moon for which we don't have actual physical samples. The Y-axis plots N, the numbers of impact craters in areas where Apollo and Luna samples were collected. The laboratory determined ages of those samples are plotted along the X-axis. The units for the X-axis are easy to understand - the rock's age of formation in gigayears (billions of years). The Y-axis units are the cummulative number of craters equal to or larger than 1 km in diameter per square kilometer. Remote sensing scientists use the best lunar images to count the number of primary impact craters in areas centered on the Apollo and Luna sample collection locations. Typically these crater counts cover areas of hundreds of square kilometers in order to ensure a statistically meaningful value of N. This graph has been around for a few decades but Copernicus didn't fit - it seemed to have too many subsequent craters compared to its assumed age of 0.8 Ga based on dating of Apollo 12 samples of what may be a ray from Copernicus. But now Harry Heisinger and colleagues have used high resolution LRO images to recounted craters that formed on top of Copernicus and its ejecta, determining a value of N (red cross) that falls exactly where predicted. The other red crosses (enlarged in graph b) show that the newly determined values of N for Tycho and Apollo 16's North Ray Crater confirm previous estimates. The power of this graph is that you can count craters for any area of geologic interest on the Moon and extend a horizontal line from the calculated value of N on the Y-axis to the right until it intersects the curve. Dropping straight down to the X-axis gives the age based on calibrated crater counts. Kaguya scientists used this technique when they determined that there were lavas as young as 1.2 Ga old in Oceanus Procellarum. This figure is also a history of bombardment of the Moon, with the tail of accretion accounting for the steep drop in N until about 3.5 Ga. No one really knows why the cratering rate stablilized with only a slow decrease from 3.5 to 1 Ga, or why it plummeted since then. But there are considerable uncertainies in this curve - lunar samples were dated to determine ages for Nectaris, Copernicus and Tycho, but there is no certain evidence that the samples actually came from those features!
Chuck Wood
A personal note - In 1970 Bill Hartmann and I used crater counting to calculate an age of 160 to 700 million years for Tycho.
Related Links
How old are young lunar craters? Hiesinger, H., C. H. van der Bogert, J. H. Pasckert, L. Funcke, L. Giacomini, L. R. Ostrach, and M. S. Robinson (2012) Journal of Geophysical Reseach 117, E00H10, doi:10.1029/2011JE003935


