Difference between revisions of "April 6, 2012"
| Line 3: | Line 3: | ||
<!-- ws:start:WikiTextHeadingRule:0:<h1> --> | <!-- ws:start:WikiTextHeadingRule:0:<h1> --> | ||
<!-- ws:start:WikiTextLocalImageRule:6:<img src="/file/view/LPOD-Apr6-12.jpg/318094594/LPOD-Apr6-12.jpg" alt="" title="" /> -->[[File:LPOD-Apr6-12.jpg|LPOD-Apr6-12.jpg]]<!-- ws:end:WikiTextLocalImageRule:6 --><br /> | <!-- ws:start:WikiTextLocalImageRule:6:<img src="/file/view/LPOD-Apr6-12.jpg/318094594/LPOD-Apr6-12.jpg" alt="" title="" /> -->[[File:LPOD-Apr6-12.jpg|LPOD-Apr6-12.jpg]]<!-- ws:end:WikiTextLocalImageRule:6 --><br /> | ||
| − | <em>image by [mailto:peter5@peterweb.com | + | <em>image by [mailto:peter5@peterweb.com Peter Oberc], Ljubljana, Slovenia</em><br /> |
<br /> | <br /> | ||
Here is a great example of the complementarity of grazing illumination telescopic views and spacecraft data. Peter recently acquired this<br /> | Here is a great example of the complementarity of grazing illumination telescopic views and spacecraft data. Peter recently acquired this<br /> | ||
image of Arago and its two domes, Alpha (above) and Beta (left). These domes are known to be relatively tall and rough textured, the latter<br /> | image of Arago and its two domes, Alpha (above) and Beta (left). These domes are known to be relatively tall and rough textured, the latter<br /> | ||
| − | characteristic showing up in the image. I created some profiles using the LOLA altimetry data from the LRO QuickMap [http://target.lroc.asu.edu/da/qmap.html | + | characteristic showing up in the image. I created some profiles using the LOLA altimetry data from the LRO QuickMap [http://target.lroc.asu.edu/da/qmap.html website] to explore<br /> |
their heights and shapes, and found some unanticipated surprises. The top profile at upper left covers the area shown by the light grey line <br /> | their heights and shapes, and found some unanticipated surprises. The top profile at upper left covers the area shown by the light grey line <br /> | ||
which crosses the barely visible dome from about west to east. The surprise is that the mare surface the dome erupted onto slopes <br /> | which crosses the barely visible dome from about west to east. The surprise is that the mare surface the dome erupted onto slopes <br /> | ||
significantly toward the east – the center of the Tranquillitatis Basin – over just the 43 km of the traverse. The dome rises about 230 m <br /> | significantly toward the east – the center of the Tranquillitatis Basin – over just the 43 km of the traverse. The dome rises about 230 m <br /> | ||
above the adjacent mare to the west, but nearly 450 m above the mare to the east. This factor of two could account for differences in <br /> | above the adjacent mare to the west, but nearly 450 m above the mare to the east. This factor of two could account for differences in <br /> | ||
| − | telescopically measured values, although the GLR [http://astroimg.org/articles/IcarusDomesPaper.pdf | + | telescopically measured values, although the GLR [http://astroimg.org/articles/IcarusDomesPaper.pdf group] value of 330 m falls in the middle, a good average value. A similar west to east <br /> |
profile across the Beta dome (middle graph) reveals a similar regional tilt to the east so that the dome’s height differs depending on which <br /> | profile across the Beta dome (middle graph) reveals a similar regional tilt to the east so that the dome’s height differs depending on which <br /> | ||
side is measured. A north to south profile (bottom) goes more along a constant contour so that the dome's height does not vary as strongly. <br /> | side is measured. A north to south profile (bottom) goes more along a constant contour so that the dome's height does not vary as strongly. <br /> | ||
| Line 18: | Line 18: | ||
features just barely visible in the higher Sun LRO mosaic, giving guidance to where topo profiles should be investigated.<br /> | features just barely visible in the higher Sun LRO mosaic, giving guidance to where topo profiles should be investigated.<br /> | ||
<br /> | <br /> | ||
| − | <em>[mailto:tychocrater@yahoo.com | + | <em>[mailto:tychocrater@yahoo.com Chuck Wood]</em><br /> |
<br /> | <br /> | ||
<strong>Technical Details</strong><br /> | <strong>Technical Details</strong><br /> | ||
| Line 26: | Line 26: | ||
<strong>Related Links</strong><br /> | <strong>Related Links</strong><br /> | ||
Rükl plate [http://the-moon.wikispaces.com/R%C3%BCkl+35 35]<br /> | Rükl plate [http://the-moon.wikispaces.com/R%C3%BCkl+35 35]<br /> | ||
| − | Slovenia astronomy [http://www.astronom.si/galerija/index.php?u=3 | + | Slovenia astronomy [http://www.astronom.si/galerija/index.php?u=3 website]<br /> |
<br /> | <br /> | ||
<hr /> | <hr /> | ||
Revision as of 17:47, 11 January 2015
Domical Profiles

image by Peter Oberc, Ljubljana, Slovenia
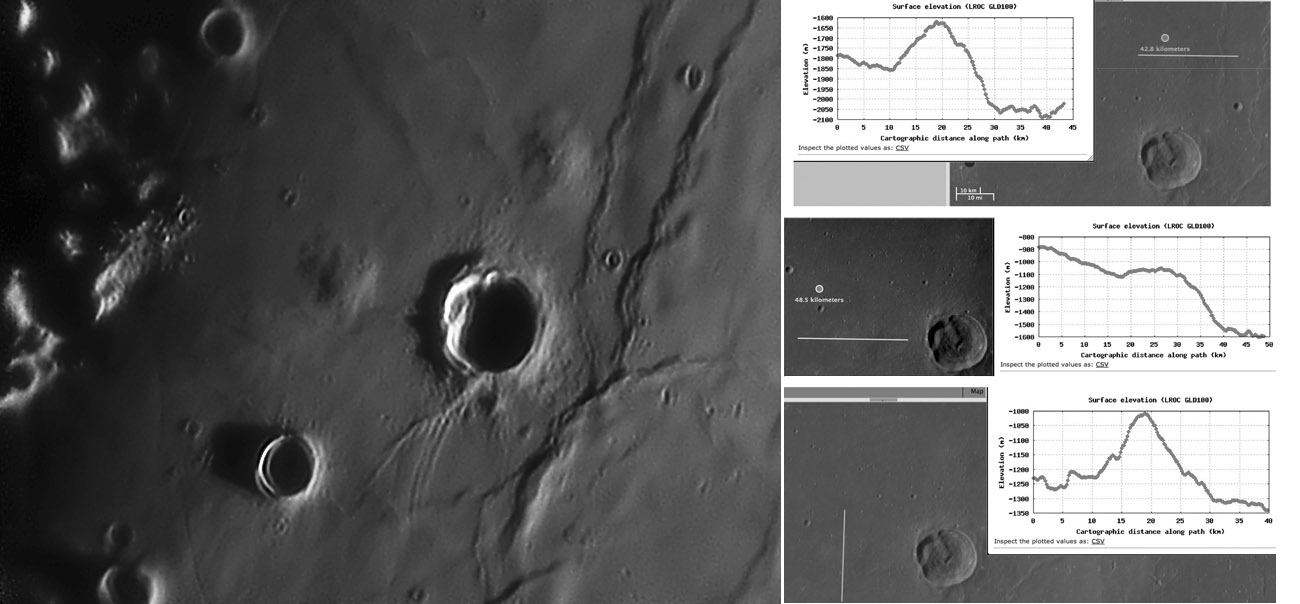
Here is a great example of the complementarity of grazing illumination telescopic views and spacecraft data. Peter recently acquired this
image of Arago and its two domes, Alpha (above) and Beta (left). These domes are known to be relatively tall and rough textured, the latter
characteristic showing up in the image. I created some profiles using the LOLA altimetry data from the LRO QuickMap website to explore
their heights and shapes, and found some unanticipated surprises. The top profile at upper left covers the area shown by the light grey line
which crosses the barely visible dome from about west to east. The surprise is that the mare surface the dome erupted onto slopes
significantly toward the east – the center of the Tranquillitatis Basin – over just the 43 km of the traverse. The dome rises about 230 m
above the adjacent mare to the west, but nearly 450 m above the mare to the east. This factor of two could account for differences in
telescopically measured values, although the GLR group value of 330 m falls in the middle, a good average value. A similar west to east
profile across the Beta dome (middle graph) reveals a similar regional tilt to the east so that the dome’s height differs depending on which
side is measured. A north to south profile (bottom) goes more along a constant contour so that the dome's height does not vary as strongly.
Beta is about 225 m high on the north and 300 m on the south, generally confirming the GLR value of 270 m. Peter's image reveals topograpic
features just barely visible in the higher Sun LRO mosaic, giving guidance to where topo profiles should be investigated.
Chuck Wood
Technical Details
28 March 2012, 18:25UT. Scope: C11 @ 6000mm, 0,13"/px, IR filter + Camera: Basler Ace ACA1300-30GM (mono) + Processing: AutoStakkert
2 + Astra Image + Photoshop
Related Links
Rükl plate 35
Slovenia astronomy website


